Wednesday, June 11, 2014

The vision thing - it's all about the links


I've been involved in a few Twitter exchanges about the upcoming pro-iBiosphere meeting regarding the "Open Biodiversity Knowledge Management System (OBKMS)", which is the topic of the meeting. Because for the life of me I can't find an explanation of what "Open Biodiversity Knowledge Management System" is, other than vague generalities and appeals to the magic pixie dust that is "Linked Open Data" and "RDF", I've been grumbling away on Twitter.

So, here's my take on what needs to be done. Fundamentally, if we are going to link biodiversity information together we need to build a network. What we have (for the most part) at the moment is a bunch of nodes (which you can think of as data providers such as natural history collections, databases, etc., or different kinds of data, such as names, publications, sequences, specimens, etc.).

1
We'd like a network, so that we can link information together, perhaps to discover new knowledge, to serve as a pathway for analyses that combine different sorts of data, and so on:

2
A network has nodes and links. Without the links there's no network. The fundamental problem as I see it is that we have nodes that have clear stakeholders (e.g., individual, museums, herbaria, publishers, database owners, etc.). They often build links, but they are typically incomplete (they don't link to everything that is relevant), and transitory (there's no mechanism to facilitate persistence of the links). There is no stakeholder for whom the links are most important. So, we have this:

3
This sucks. I think we need an entity, a project, and organisation, whatever you want to call it for whom the network is everything. In other words, they see the world like this:
4
If this is how you view the world, then your aim is to build that network. You live or die based on the performance of that network. You make sure the links exist, they are discoverable, and that they persist. You don't have the same interests as the nodes, but clearly you need to provide value to them because they are the endpoints of your links. But you also have users who don't need the nodes per see, they need the network.

If you buy this, then you need to think about how to grow the network. Are there network effects that you can leverage, in the same way CrossRef has with publishers submitting lists of literature cited linked to DOIs, or in social media where you give access to your list of contacts to build your social graph?

If the network is the goal, you don't just think "let's just stick HTTP URLs on everything and it will all be good". You can think like that if you are a node, because if the links die you can still persist (you'll still have people visiting your own web site). But if you are a network and the links die, you are in big trouble. So you develop ways to make the network robust. This is one reason why CrossRef uses an identifier based on indirection, it makes it easier to ensure the network persists in the face of change in how the nodes serve their data. What is often missed is that this also frees up the nodes, because they don't need to commit to serving a given URL in perpetuity, indirections shields them from this.

In order to serve users of the network, you want to ensure you can satisfy their needs rapidly. This leads to things like caching links and basic data about the end points of those links (think how Google caches the contents of web pages so if the site is offline you may still find what you are looking for).

If your business depends on the network, then you need to think how you can create incentives for nodes to join. For example, what services can you offer them that make you invaluable to the nodes? Once you crack that, then all sorts of things can happen. Take structured markup as an example. Google is driving this on the web using schema.org. If you want to be properly indexed by Google, and have Google display your content in a rich form (e.g., thumbnails, review ratings, location, etc.) you need to mark up your page in a way Google understands. Given that some businesses live or die based on their Google ranking, there's a strong incentive for web sites to adopt this markup. There's a strong incentive for Google to encourage markup so that it can provide informative results for its users (otherwise they might rely on "social search" via Facebook and mobile apps). This is the kind of thing you want the network to aim for.

In summary, this is my take on where we are at in biodiversity informatics. The challenge is that the organisations in the room discussing this are typically all nodes, and I'd argue that by definition they aren't in a position to solve the problem. You need to pivot (ghastly word) and think about it from the perspective of the network. Imagine you were to form a company whose mission was to build that network. How would you do it, how would you convince the nodes to engage, what value would you offer them, what value would you offer users of the network? If we start thinking along those lines, then I think we can make progress.

Saturday, June 07, 2014

Using GBIF to measure the lag between collection and description of a species (oh dear)

I'm adding more charts to the GBIF Chart tool, including some to explore the type status of specimens from the Solomon Islands. There are nearly 500 holotypes from this region, so quite a few new species have been discovered in this region.

Inspired by the Benoît Fontaine et al. paper on the lag time between a species being discovered and subsequently described (see Species wait 21 years to be described - show me the data) I thought I would do a quick and dirty plot of the difference between the year a specimen was collected and the year the name of the taxon it belongs to was published (from the authorship string for the scientific name). Plotting the results was *cough* interesting:
Types
In theory, the difference between the two dates should be negative (if you subtract publication year from collection year), the smaller number the less the wait for description. But I found some large positive numbers, implying that taxa had been described long before the types were discovered! Something is clearly wrong. What seems to be happening here is the GBIF has failed to match the species name for an occurrence, and so goes up the taxonomic hierarchy and just records the genus. For example, http://gbif.org/occurrence/472764211 was collected in 1965 and is the type of Pandanus guadalcanalius St.John. GBIF doesn't recognise this name, and so matches the occurrence to the genus Pandanus Linnaeus, 1782. hence it looks like we've used a time machine to describe a taxon in 1782 based on a specimen from 1965.

At the other end of the spectrum, there are a lot of specimens that seem to have waited over 200 years for description! Turns out these are mostly specimens from the MCZ that have their collection date recorded by GBIF as "1700-01-01". This seems an arbitrary date, and turns out it's an artefact. The MCZ records "unknown" collection dates as the range 1700-01-01 - 2100-01-01
(see http://mczbase.mcz.harvard.edu/guid/MCZ:IZ:DIPL-4985). Unfortunately, when it generates the export for GBIF, these get truncated to 1700-01-01, and GBIF then (not unreasonably) treats that as the actual collection date. Somewhere in the middle of the plot of lag between collection and description is some interesting information, but it's a pity that most of this is obscured by some serious data errors.

For me the bigger lesson here is the power of visualisation to explore the data and to expose errors. This is why I was underwhelmed by the new charts GBIF is releasing. Plots of ever upward trends are ultimately not very useful. They don't give much insight into the data, nor do they help tackle interesting questions. I think we need a much richer set of visualisations to really understand the strengths and limitations of the data in GBIF.

Update


Investigating further, there are some other reasons for the "back to the future" types. For example, http://www.gbif.org/occurrence/188826624 (CAS 5506 from FishBase) was collected in 1933 and is recorded as a holotype, with the scientific name Cypselurus opisthopus (Bleeker, 1865). 1933 - 1865 = 68, so the taxon was named 68 years before it was collected(!).

A bit of investigation using BioNames, BioStor, and GBIF (http://www.gbif.org/occurrence/473244692, another record for CAS 5506) reveals that CAS 5506 is the holotype for Cypselurus crockeri, shown below in a plate from it's original description (published in 1935):
Seale A (1935) The Templeton Crocker Expedition to western Polynesian and Melanesian islands, 1933. No. 27. Fishes. Proceedings of the California Academy of Sciences 21: 337–378. http://biostor.org/reference/59326

So, in fact this species was described shortly after its collection, with a lag of 1933 - 1935 = -2 years.

Proceedingsofcal421193336cali 0397
Apart from the duplication issue (FishBase has replicated some of the CAS dataset, sigh), the other problem is one of modelling the data. The CAS record has the original taxon name for which CAS 5506 is the type (Cypselurus crockeri), the FishBase record has the currently accepted name for the taxon (Cypselurus opisthopus). These two different approaches have very different implications for the charts I'm making, and simply reinforce my feeling that the GBIF data is both fascinating and full of "gotchas!".

Friday, June 06, 2014

Finding citations using full text search

Note to self on citation matching.

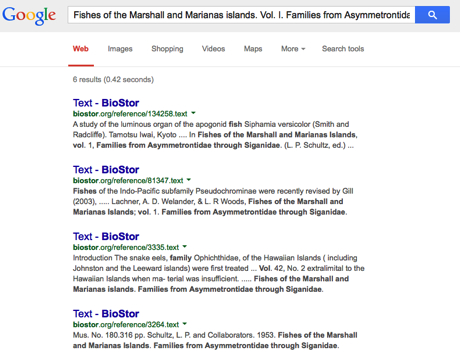
Looking for this paper "Fishes of the Marshall and Marianas islands. Vol. I. Families from Asymmetrontidae through Siganidae" I Googled it, adding "bistro" as a search term to see if I'd already added it to BioStor. The Google search:

https://www.google.co.uk/?gws_rd=ssl#q=Fishes+of+the+Marshall+and+Marianas+islands.+Vol.+I.+Families+from+Asymmetrontidae+through+Siganidae+biostor

found several hits in BioStor:

Google
What is interesting is that these hits are to full text of references that cite the article I'm after, not the article itself. I'm sure many have had this experience, where you are searching for an obscure article and you keep finding papers that cite it, rather than the actual paper you're after. But this suggests another strategy for building the citation graph for an article. If you have a decent corpus of full text articles, search for the article (using, say title, journal, pagination) in the text of those articles and store the hits. Those are the references that cite the article (OK, not all, but some of them). This may be a more attractive way of building the citation graph, rather than parsing citations in articles and trying to locate them. Indeed, it could be extended to help marking up those citations. Imagine grabbing blocks of text from near the end of an article, searching for those in a database of citations, using close matches to flag the corresponding block as a citation.

Need to think about this a little more...

Update


The paper is:

Polepeddi, L., Agrawal, A., & Choudhary, A. (n.d.). Poll: A Citation Text Based System for Identifying High-Impact Contributions of an Article. 2011 IEEE 11th International Conference on Data Mining Workshops. IEEE. doi:10.1109/icdmw.2011.136/blockquote>

More on visualisation of GBIF data

Following on from the previous post on visualising GBIF data, I've added some more interactivity. If you click on a pane in the treemap widget you get a list of the corresponding taxa, together with an image from EOL (if one exists). It's a fun way to quickly see what sort of species are present (in this case in the Solomon Islands). You can try it at http://bionames.org/~rpage/gbif-stats/.

Stats2

Pro tip


It's not obvious from the site, but to go back up the taxonomic hierarchy in the treemap, right click (ctrl-click on a Mac) on the grey bar corresponding to the higher taxon.

Wednesday, June 04, 2014

Visual analysis of GBIF data

Tim Roberston and the ream at GBIF are working on some nice visualisations of GBIF data, and have made an early release available for viewing: http://analytics.gbif-uat.org. For a given country, say, the Solomon Islands, you can see numerous plots, mostly like this:

Gbif

Ever the critic, as much as I like this (and appreciate the scale of the task underlying doing analytics on data at the scale of GBIF), what I would really like to see is something that more closely resembles Google Analytics. I want graphs that I can use to get some insight into the data, and which lead me to ask questions (and provide easy for me to discover the answers).

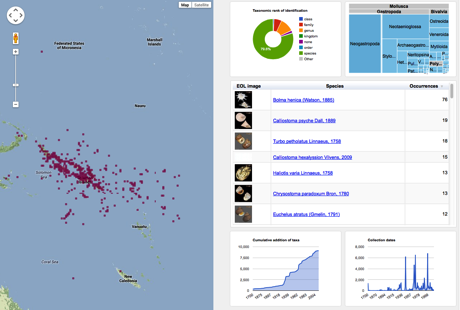
So, I put together a crude, live demo of the sort of thing I'd like to see. You can see it at http://bionames.org/~rpage/gbif-stats (can't promise that this link will be long-lived), and below is a screen shot:
Stats
What I've done is fetch all the occurrence records for the Solomon Islands from GBIF (using the API), dumped that into CouchDB, and generated some simple queries. I display the results using Google Charts. There are some similarities with the tools developed by Javier Otegui, Arturo Ariño, and colleagues.

Otegui, J., Ariño, A. H., Encinas, M. A., & Pando, F. (2013, January 25). Assessing the Primary Data Hosted by the Spanish Node of the Global Biodiversity Information Facility (GBIF). (G. P. S. Raghava, Ed.)PLoS ONE. Public Library of Science (PLoS). doi:10.1371/journal.pone.0055144
Otegui, J., & Arino, A. H. (2012, August 15). BIDDSAT: visualizing the content of biodiversity data publishers in the Global Biodiversity Information Facility network. Bioinformatics. Oxford University Press (OUP). doi:10.1093/bioinformatics/bts359


For fun I've also added a map of the GBIF occurrences (also served from CouchDB).

Here's quick guide to some of the charts. Below you can see (left) a plot of species accumulation over time, that is the total number of species that have been collected up to that time. If we had collected all the species we'd expect this to asymptote (flatten out). If it keeps going up, then we still need to do some sampling. On the right is the number of occurrences recorded for each year. You can see that collecting is highly episodic.

Stats2

To get a little more information on this, I've generated a crude chart where the rows are institutions (e.g., museums and herbaria) that have specimens, and the number of occurrences collected each decade are represented by the shaded boxes (the rightmost box is the current decade) (if you hover over a bar you will see a popup with the decade). To the right is the total number of occurrences.

Chart
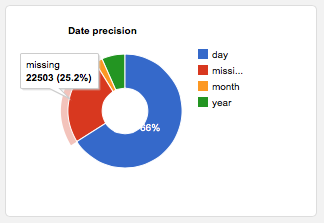
From this we can see that there have been some major collections at various times (e.g., Kew in the 1960's, the Australian Museum in the 1970's to 1990's). Strangely, the MCZ has lots of specimens from the 1700's, I suspect we have a data quality issue here. There are certainly some issues with dates in this data set, with about a quarter of occurrences with no date:

Date

Note that the data for the Solomon Islands, comes from all around the world, mostly from the US. There is a big spike in the date of collection curve in 1944, suggesting a lot of material may be the result of collecting by US servicemen in WW2.

Map

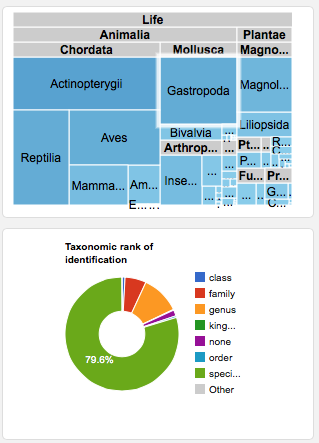
I use a treemap to display the taxonomic distribution of the records, and a donut chart to summarise the taxonomic level to which the occurrences are identified:

Taxa
The treemap is dominated by vertebrates, which I suspect is a poor reflection of the actual taxonomic composition of the Solomon Islands biota. Over 3/4 of the occurrences are identified to species level, which is encouraging, but there's clearly a lot of material that needs some taxonomic work.

Where next


This has been made in a rush, and there is a lot which could be done. For example, some of the charts would be more useful if you could drill down and explore further. This could be done via the GBIF API or portal (for example, by constructing a URL that shows the portal results for the Solomon Islands for a given year of collection).

There are, of course, issues of scalability. I've made this for the 83,364 occurrences currently in the GBIF portal for the Solomon Islands. There would need to be some thought given to how this could be scaled to larger data sets. But I think this is worth pursuing so that we can get further insights into the remarkable database that GBIF is building.

Monday, June 02, 2014

BioNames one year on

B8e253dc3be3d84f2c69c51b0af86c03 400x400It is almost a year to the day that I released BioNames, a database of "taxa, texts, and trees". This project was my entry in EOL's Computable Data Challenge. Since it went live (after much late night programming by myself and Ryan Schenk) I've been tweaking the interface, cleaning (so much cleaning), and adding data (mostly DOIs, links to BioStor, and PDFs). I also wrote a paper describing the project, published in PeerJ (http://dx.doi.org/10.7717/peerj.190).

Why BioNames?


I'm building BioNames to scratch a very specific itch. To me it is a source of enormous frustration that one of the most basic questions we can ask about a name (where was it first published?) is difficult to answer using current taxonomic databases. And if there is an answer, it is usually given as a text string describing the publication (i.e., a literature citation) rather than an identifier such as a DOI that enables me to (a) go to the publication, (b) refer to the publication in a database in an unambiguous way, and (c) discover further information about that publication by querying services that recognise that identifier.

There are enormous digitisation efforts underway by commercial publishers, digital archives, and libraries, and all of this is putting more and more literature online. This is the primary evidence base for taxonomy, it is where new names are published, taxa are described, and hypotheses of synonym and relationship are proposed, and we should be actively linking to it. Of course, there are some projects that do this, but these are typically restricted in taxonomic or geographic scope. I want all this information together in one place. Hence, BioNames.

Of course, I could wait until projects like ZooBank have all the animal names, but as I pointed out in Why the ICZN is in trouble, the ICZN and ZooBank have only a tiny fraction of the published names:
ICZN
This renders ZooBank barely usable for my purposes. There are millions of animal names in circulation, and our inability to discover much about them leads to all sorts of headaches, such as the errors in GBIF that I've mentioned earlier on this blog. I want a tool that can help me interpret those errors, and I want it now, hence BioNames.

What is in BioNames?


The original data comes from the LSID metadata served by ION. At the moment BioNames has 4,880,925 names, 1,549,152 of which are linked to a bibliographic citation. The bulk of the time I spend on BioNames consists of cleaning and clustering these citations, and linking them to digital identifiers.

To get some insight into what is left to be done I created a CSV dump of the publication data underlying BioNames, and loaded it into Google's Cloud Storage (http://storage.googleapis.com/ion-names/names3.csv). I then used Google's BigQuery to write some simple SQL queries. You can find more details here: https://github.com/rdmpage/bionames-bigquery.

Here is a summary table of the number of names that are published in an article with one of the identifiers that I track. These include DOIs, PMIDs, as well as whether the article is in BioStor, has a URL (typically to a publisher's web site), or a PDF.
IdentifierNumber of names
DOI196,915
BioStor130,792
JSTOR23,483
CiNii11,296
PMID8,886
URL72,754
PDF161,474
(any)489,029


The final row is the number of articles that have at least one identifier (some articles have multiple identifiers, such as a DOI and a link to BioStor). Given that there are approximate 1.5 million names with bibliographic citations, and around 490,000 have an identifier, the user as a 30% chance of finding the original description for an animal name picked at random. Obviously, BioNames has gaps (ION has missed a number of names, and/or publications), the taxonomic coverage of bibliographic identifiers is uneven (depending on the publications chosen by taxonomists to publish in, and the level of digitisation of those publications), and there is still a lot of data cleaning to do. But an almost 1 in 3 chance of finding something useful for a name seems a reasonable level of progress.

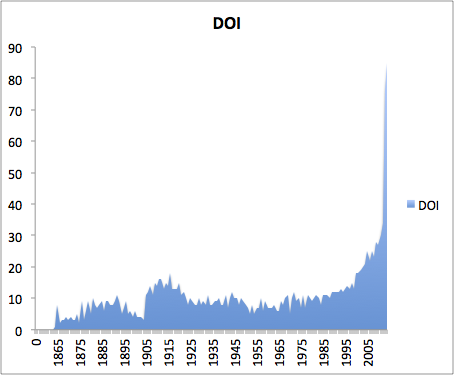
Out of interest I created some quick and dirty charts in Excel for different categories of identifier. Here, for example, is the percentage of names published each year that are linked to a publication with a DOI:
Doi
Over 80% of names published in 2013 were in an article with a DOI, so we are fast heading to a situation where modern zoological taxonomy is fully part of the citation graph of science. Much of this spike in 2013 is due to the adoption of DOIs by Zootaxa, which is far and away the dominant journal in animal taxonomy.

Here is the same chart for publications in BioStor.
Biostor graph
The big spike at the start is for names where the year of publication is missing. Leaving that aside, we can see the impact of the 1923 copyright cut-off in the US, which puts a big dent in the Biodiversity Heritage Library's digitisation efforts. Note, however, that BHL has a lot of post-1923 content.


Does anyone use BioNames?


I use BioNames almost every day, and have devoted way more time than is healthy to populating it. As I explore issues like the quality of the taxonomy in GBIF, I find it useful to see the original descriptions of a taxa, and its fate in subsequent revisions. In the early days I'd spend more time adding missing papers to help answer a question, but increasingly I'm finding that the content is already there. So, I find it useful, but what (gulp) if I'm the only one?

Below is the number of "sessions" per day since BioNames was launched (data from Google Analaytics for May 1st, 2013 to May 31st, 2014). After an initial flurry of interest, web traffic pretty quickly died off. Since then it's been slowly gaining more visitors, then (for reasons which escape me), it started getting a lot more traffic in April onwards:
Bionames
To give these numbers some context, for the same period BioStor (my archive of articles from BHL) had the following traffic:
Biostor
Note the different scales, BioStor is getting around 500 sessions a day during week days, BioNames gets around 200. By way of comparison, GBIF gets up to 4000 sessions a day, and this blog typically has 50-100 sessions per day.

Where next?


There are a couple of directions for the future. There is still a lot of data cleaning and linking to do. Last year I did a quick analysis of which taxonomic journals should be digitised next. I've updated this by creating a a spreadsheet that ranks the journals in BioNames by the number of names each has published, and each is coloured by the fraction of those names for which I've found a digital identifier for the paper in which they are published. This table is incomplete, and reflects not only the extent of digitisation, but also the extent to which I've managed to locate the journals online. But it is a starting point for thinking about what journals to prioritise for digitisation, or if they are already divitised, journals that I need to target for addition to BioNames. The spreadsheet is available as a Google sheet.

Another direction is data mining. In addition to the obvious task, naming locating and indexing taxonomic names, there are other things to be done. In BioStor I extract geographic point localities and specimen codes from the OCR text. These could be indexed to enable geographic or specimen-based searching. The same approach could be generalised to the literature in BioNames, so that we could track the mentions of a particular specimen, or retrieve lists of publications about a specific locality (e.g., all taxonomic papers that refer to a particular mountain range, deep sea vent, or island).

BioNames also does some limited analysis of taxonomic name co-ocurrence, for example suggesting that species names with the same specific epithet but different generic names are possible synonyms if they occur on the same page. There is a lot of scope for expanding this. I'm also keen to explore citation indexing, that is, extracting lists of literature cited from articles in BioNames, and linking those to the corresponding record in BioNames. Ultimately I want to be able to navigate through the taxonomic literature along these citation links, so that we can trace the fate of names through time.

But this is still only a start, papers such as Seltmann et al. illustrate other things that are possible once we have a large corpus of taxonomic literature available:

Seltmann, K. C., Pénzes, Z., Yoder, M. J., Bertone, M. A., & Deans, A. R. (2013, February 18). Utilizing Descriptive Statements from the Biodiversity Heritage Library to Expand the Hymenoptera Anatomy Ontology. (C. S. Moreau, Ed.)PLoS ONE. Public Library of Science (PLoS). doi:10.1371/journal.pone.0055674


So, a lot still to be done. I hope to have achieved some of this if and when I write a follow up post on the status of BioNames in a year's time.